This data represents the most current publicly available information sources that are commonly used to study health care trends. The data is derived from the data sources listed below and combined to support the analysis.
A blank entry indicates unreported data. A value of zero is a defined value and does not represent unreported data.
State: The abbreviated name of the state where the county is located.
County: The name of the county where the information was collected. County names are listed as provided on the United States Census Bureau's list of 2020 FIPS Codes for Counties and County Equivalent Entities.
Population Size: The total number of individuals residing in the county. The data is derived from the Census Population Estimates from 2021.
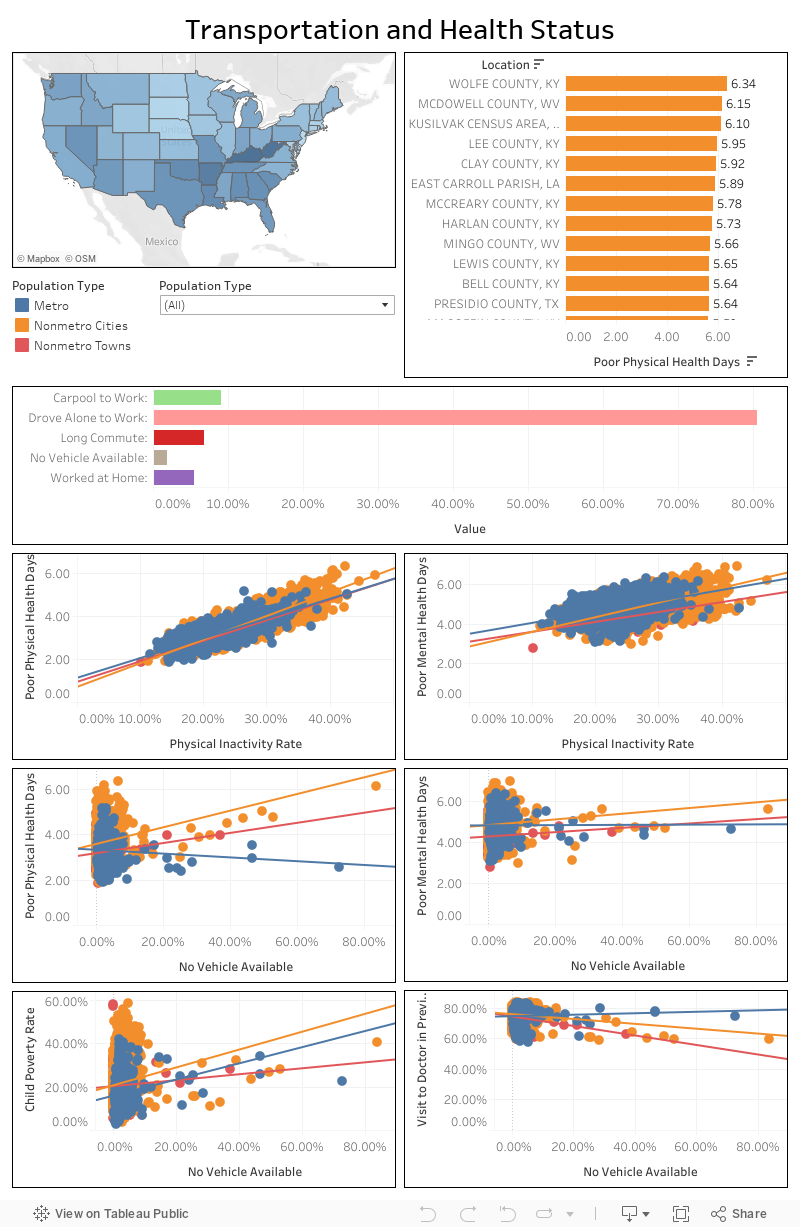
Population Type: The population type is determined based on the population size of a specific county. The population types include metro, nonmetro cities, and nonmetro towns. These types are adapted from the rural-urban commuting area codes (RUCA) and core-based statistical areas (CBSA) definitions of rural and urban. The population types for counties are defined as follows:
- Metro - A population of 50,000 or more
- Nonmetro cities - A population between 2,500 and less than 50,000
- Nonmetro towns - A population of less than 2,500
Poor or Fair Health: Self-reported health status is a general measure of health-related quality of life (HRQoL) in a population. Age-adjusted data is from the Behavioral Risk Factor Surveillance System (BRFSS) survey from 2020.
Poor Physical Health Days: The average number of days a county's adult respondents report that their physical health was poor in the past 30 days. Age-adjusted data is from the Behavioral Risk Factor Surveillance System (BRFSS) survey from 2020.
Poor Mental Health Days: The average number of days a county's adult respondents report that their mental health was poor in the past 30 days. Age-adjusted data is from the Behavioral Risk Factor Surveillance System (BRFSS) survey from 2020.
Physical Inactivity: The percentage of adults age 20 and over reporting no leisure-time physical activity. Data is from the CDC Diabetes Interactive Atlas from 2020.
Child Poverty Rate: The percentage of children under age 18 living in poverty. Poverty status is defined by family; either everyone in the family is in poverty or no one in the family is in poverty. Data is from the Small Area Income Poverty Estimates (SAIPE) in 2021.
Visits to Doctor: Percentage of respondents greater than 18 years old who report having been to a doctor for a routine checkup (e.g., a general physical exam, not an exam for a specific injury, illness, or condition) in the previous year. Data is from the Behavioral Risk Factor Surveillance System (BRFSS).
No Vehicle Available: The percentage of the county's working population (age 16 and over) who reported having no vehicle available to commute to work. Data is from the 2020 American Community Survey.
Drove Alone to Work: The percentage of the county's working population (age 16 and over) who reported driving alone to commute to work. Data is from the 2020 American Community Survey.
Carpool to Work: The percentage of the county's working population (age 16 and over) who reported carpooling on their commute to work. Data is from the 2020 American Community Survey.
Worked at Home: The percentage of the county's working population (age 16 and over) who reported working at home. Data is from the 2020 American Community Survey.
Long Commute: The percentage of the county's working population (age 16 and over) who reported having a commute to work of 60 minutes or longer. Data is from the 2020 American Community Survey.