This data represents the most current publicly available information sources that are commonly used to study health care trends. The data is derived from the data sources listed below and combined to support the analysis.
A blank entry indicates unreported data. A value of zero is a defined value and does not represent unreported data.
State: The abbreviation of the state where the hospital is located.
County: The name of the county where the hospital is located. County names are listed as provided on the US Census Bureau's list of 2020 FIPS Codes for Counties and County Equivalent Entities.
County Population Size: The total number of individuals residing in the county. The data is derived from the Census Population Estimates from 2021.
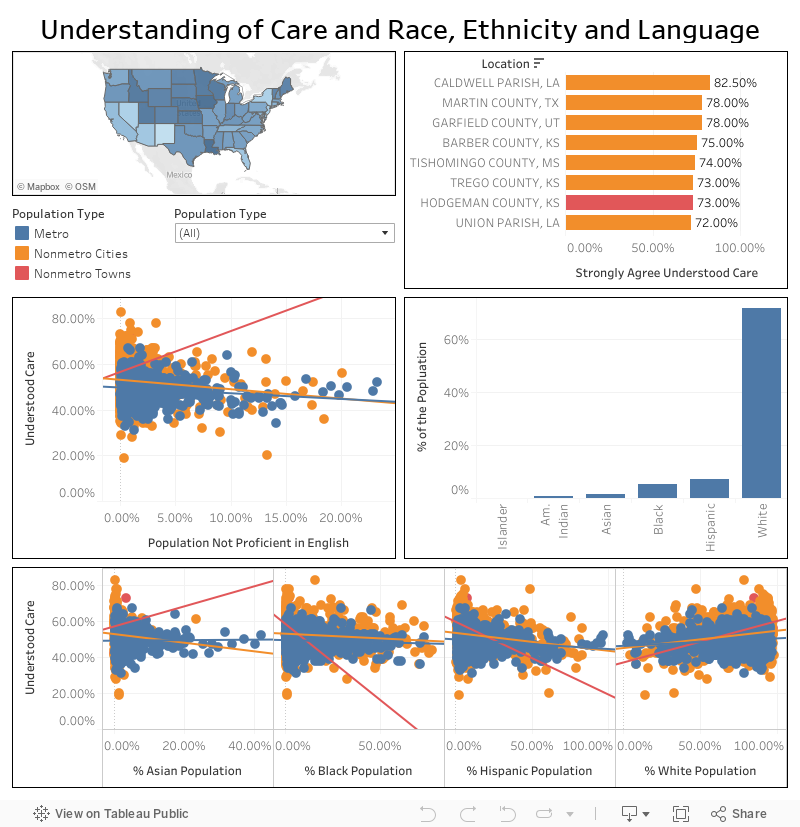
Population Type: The population type is determined based on the population size of a specific county. The population types include metro, nonmetro cities, and nonmetro towns. These types are adapted from the rural-urban commuting area codes (RUCA) and core-based statistical areas (CBSA) definitions of rural and urban. The population types for counties are defined as follows:
- Metro - A population of 50,000 or more
- Nonmetro cities - A population between 2,500 and less than 50,000
- Nonmetro towns - A population of less than 2,500
Hospital: The name of the hospital.
Address: The address for the hospital.
City: The city where the hospital is located.
ZIP Code: The zip code for the hospital.
Percent Strongly Agree Understood Care: The percentage of patients who reported on the HCAHPS survey that they "Strongly Agree" they understood their care when they left the hospital. This data is from the Hospital Consumer Assessment of Healthcare Providers and Systems (HCAHPS) survey about patient experience and satisfaction. The reporting period for this measure is October 1, 2021, through September 30, 2022.
Number of Completed Surveys: The number of completed HCAHPS surveys by patients for the specific hospital. The number must be greater than 25 to be reported.
Percent Asian: The proportion of the county’s population that falls into the racial or ethnic category of Asian from the US Census Bureau Population Estimates from 2021.
Percent Black: The proportion of the county’s population that falls into the racial or ethnic category of Black from the US Census Bureau Population Estimates from 2021.
Percent Hispanic: The proportion of the county’s population that falls into the racial or ethnic category of Hispanic from the US Census Bureau Population Estimates from 2021.
Percent Native Hawaiian or Other Pacific Islander: The proportion of the county’s population that falls into the racial or ethnic category of Native Hawaiian or Other Pacific Islander from the US Census Bureau Population Estimates from 2021.
Percent Native American: The proportion of the county’s population that falls into the racial or ethnic category of Native American from the US Census Bureau Population Estimates from 2021.
Percent White: The proportion of the county’s population that falls into the racial or ethnic category of White from the US Census Bureau Population Estimates from 2021.
Percent Not Proficient in English: The proportion of the county’s population that is not proficient in English from the American Community Survey from 2017-2021.