This data represents the most current publicly available information sources that are commonly used to study health care trends. The data is derived from the data sources listed below and combined to support the analysis.
County Health Rankings (data released 2023)
A blank entry indicates unreported data. A value of zero is a defined value and does not represent unreported data.
State: The abbreviation of the state.
Population Size: The total number of individuals residing in the county. The data is derived from the Census Population Estimates from 2021.
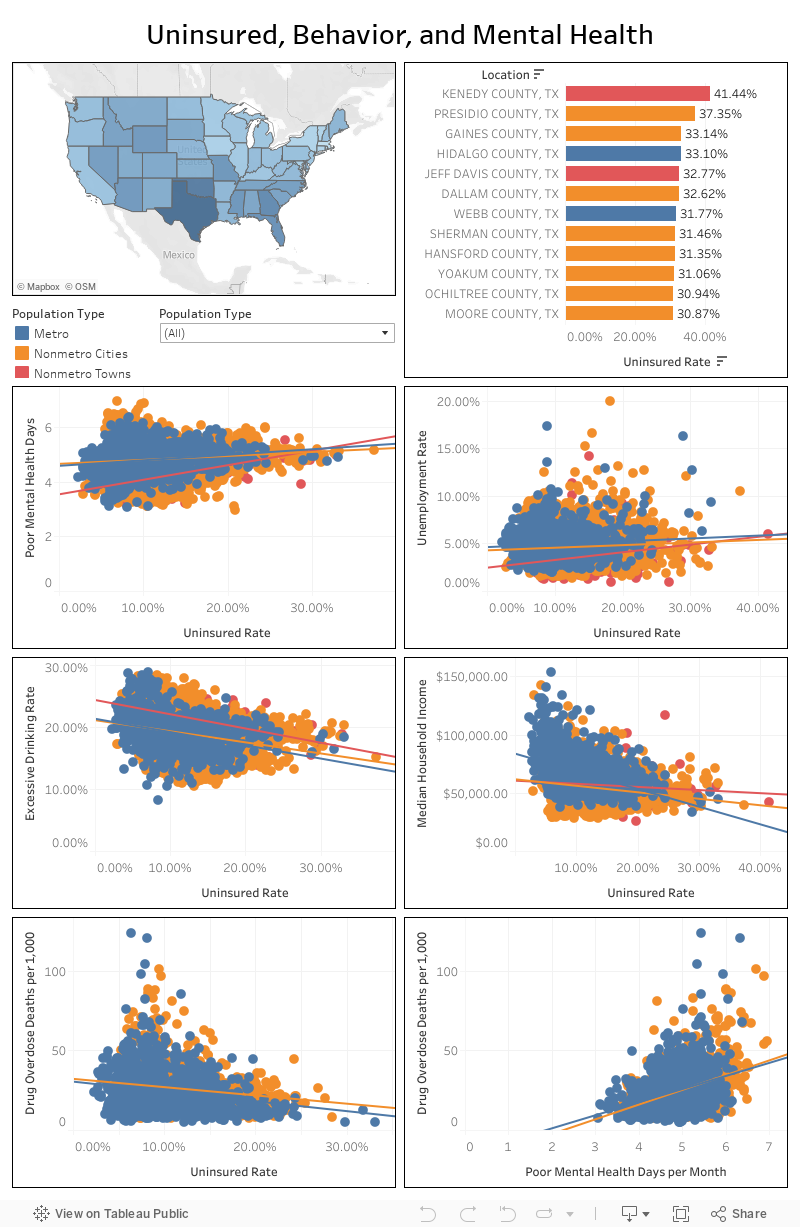
Population Type: The population type is determined based on the population size of a specific county. The population types include metro, nonmetro cities, and nonmetro towns. These types are adapted from the rural-urban commuting area codes (RUCA) and core-based statistical areas (CBSA) definitions of rural and urban. The population types for counties are defined as follows:
- Metro - A population of 50,000 or more
- Nonmetro cities - A population between 2,500 and less than 50,000
- Nonmetro towns - A population of less than 2,500
County: The name of the county. County names are listed as provided on the U.S. Census Bureau's list of 2020 FIPS Codes for Counties and County Equivalent Entities.
Percent Uninsured: The estimated number of individuals in the county under age 65 without health insurance. Data is from the Small Area Health Insurance Estimates (SAHIE) Program from 2020.
Median Household Income: Median annual household income. Data is from the Small Area Income and Poverty Estimates (SAIPE) in 2021.
Percent Unemployment: The estimated percentage of individuals in the county who had no employment, were available for work, and had made specific efforts to find employment. The number is from the annual U.S. Bureau of Labor Statistics’ Labor Force Data in 2021.
Percent Excessive Drinking: The percentage of adults that report either binge drinking, defined as consuming more than four (women) or five (men) alcoholic beverages on a single occasion in the past 30 days, or heavy drinking, defined as drinking more than one (women) or two (men) drinks per day on average. The reporting period for this measure is 2020. Data is from the Behavioral Risk Factor Surveillance System (BRFSS) survey.
Drug Overdose Deaths: The number of deaths due to drug poisoning per 100,000 population from the Centers for Disease Control and Prevention (CDC) WONDER mortality data from 2018 through 2020.
Teen Births: Number of births per 1,000 female population ages 15-19. The reporting period for this measure is 2014 through 2020 from the National Center for Health Statistics - Natality files.
Avg Poor Mental Health Days per Month: The average number of days a county's adult respondents report that their mental health was poor in the past 30 days. Age-adjusted data is from the BRFSS survey from 2020.