This data represents the most current publicly available information sources that are commonly used to study health care trends. The data is derived from the Data Sources listed below and combined to support the analysis.
County Health Rankings (data released 2023)
Note: Because the number of events for an indicator may be too small to report for a county for any single year, data were aggregated over several years (3, 5, or 10 years depending on county population) for the measures of birth and death to increase the number of counties with available data. Data was aggregated for counties that have a population size less than 25,000 from the years 1996-2005. Counties with a population between 25,000 and 99,999 include data that was aggregated from the years 2001-2005. Finally, counties that have a population size greater than 100,000 include data that was aggregated from the years 2003-2005. Death rates were age-adjusted to the year 2000 standard calculated by the Health Resources and Services Administration. Mortality data were from the National Center for Health Statistics, National Vital Statistics System, 1996–2005 for the ICD-9/ICD-10 codes listed after each variable.
A blank entry indicates unreported data. A value of zero is a defined value and does not represent unreported data.
State: The abbreviated name of the state where the county is located.
County: The name of the county where the information was collected. County names are listed as provided on the U.S. Census Bureau's list of 2020 FIPS Codes for Counties and County Equivalent Entities.
Population Size: The total number of individuals residing in the county. The data is derived from the Census Population Estimates from 2021.
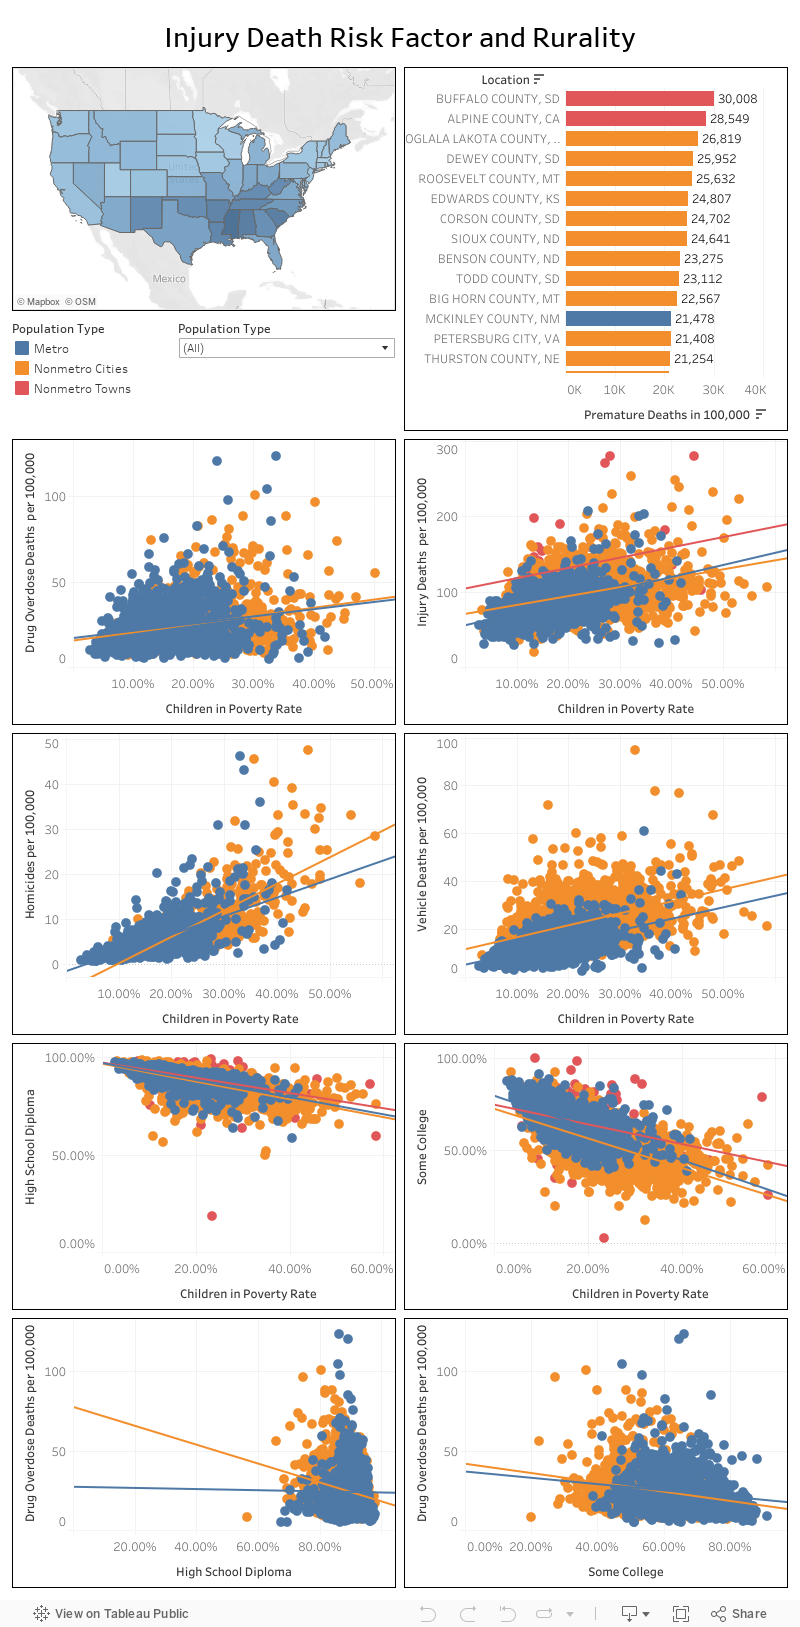
Population Type: The population type is determined based on the population size of a specific county. The population types include metro, nonmetro cities, and nonmetro towns. These types are adapted from the rural-urban commuting area codes (RUCA) and core-based statistical areas (CBSA) definitions of rural and urban. The population types for counties are defined as follows:
- Metro - A population of 50,000 or more
- Nonmetro cities - A population between 2,500 and less than 50,000
- Nonmetro towns - A population of less than 2,500
Motor Vehicle Accidents: Motor Vehicle Crash Deaths are the number of deaths due to traffic accidents involving a motor vehicle per 100,000 population from the Centers for Disease Control and Prevention (CDC) WONDER mortality data from 2014 through 2020.
Injury Deaths: The number of deaths from intentional and unintentional injuries per 100,000 population. Deaths included are those with an underlying cause of injury (ICD-10 codes *U01-*U03, V01-Y36, Y85-Y87, Y89) from CDC WONDER mortality data from 2016 through 2020.
Homicides: An estimate of the number of deaths due to homicide per 100,000 population from CDC WONDER mortality data from 2014 through 2020.
Drug Overdose Deaths: The number of deaths due to drug poisoning per 100,000 population from CDC WONDER mortality data from 2018 through 2020.
Alcohol-Impaired Driving Death Rate: The percentage of motor vehicle crash deaths with alcohol involvement from the Fatality Analysis Reporting System from 2016 through 2020.
Premature Deaths: The number of deaths under age 75 from the National Center for Health Statistics - Mortality files from 2018 through 2020.
Uninsured Rate: The estimated number of individuals in the county under age 65 without health insurance. Data is from the Small Area Health Insurance Estimates (SAHIE) Program from 2020.
Percent High School Diploma: Percentage of adults ages 25 and over with a high school diploma or equivalent. The data is from 2017-2021.
Percent with Some College: Percentage of adults ages 25-44 with some post-secondary education. The data is from 2017-2021.
Median Household Income: Median annual household income. Data is from the Small Area Income and Poverty Estimates (SAIPE) in 2021.
Child Poverty Rate: The percentage of children under age 18 living in poverty. Poverty status is defined by family; either everyone in the family is in poverty or no one in the family is in poverty. Data is from SAIPE in 2020.