A blank entry indicates unreported data. A value of zero is a defined value and does not represent unreported data.
State: The abbreviated name of the state where the county is located.
County: The name of the county where the information was collected. County names are listed as provided on the U.S. Census Bureau's list of 2020 FIPS Codes for Counties and County Equivalent Entities.
Population Size: The total number of individuals residing in the county. The data is derived from the Census Population Estimates from 2021.
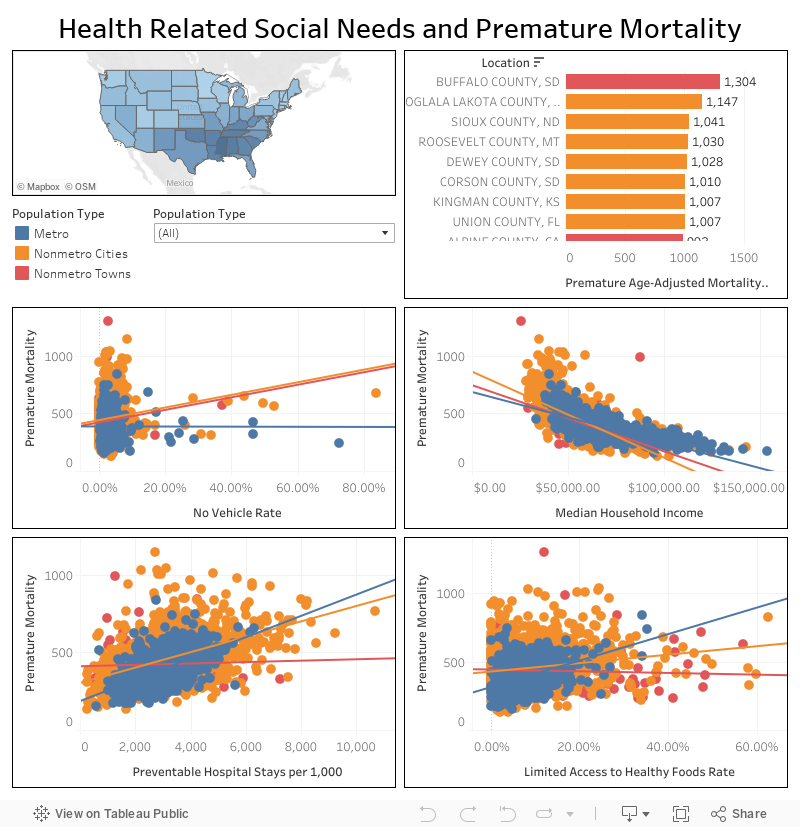
Population Type: The population type is determined based on the population size of a specific county. The population types include metro, nonmetro cities, and nonmetro towns. These types are adapted from the rural-urban commuting area codes (RUCA) and core-based statistical areas (CBSA) definitions of rural and urban. The population types for counties are defined as follows:
- Metro - A population of 50,000 or more
- Nonmetro cities - A population between 2,500 and less than 50,000
- Nonmetro towns - A population of less than 2,500
Income Inequality Rate: Ratio of household income at the 80th percentile to income at the 20th percentile. Data is from the American Community Survey from 2017 through 2021.
Median Household Income: Median annual household income. Data is from the Small Area Income and Poverty Estimates (SAIPE) in 2021.
Percent Residential Segregation Black/White: The percentage of either black or white residents that would have to move to different geographic areas in order to produce a distribution that matches that of the larger area. A lower value is desired. The value ranges from zero (complete integration) to 100 (complete segregation) and is from the American Community Survey from 2021 through 2022.
Diabetes Rate: The percentage of patients with diabetes. The reporting period for this measure is 2020 from the Centers for Disease Control and Prevention (CDC) Diabetes Interactive Atlas.
Percent Food Insecurity: The percentage of the population that lacks access, at times, to enough food for an active, healthy life for all household members and limited or uncertain availability of nutritionally adequate foods. The reporting period for this measure is 2020 from Map the Meal Gap.
Percent Limited Access to Healthy Foods: The percentage of the population that has limited access to supermarkets, supercenters, grocery stores, or other sources of healthy and affordable food may make it harder for some Americans to eat a healthy diet. The reporting period for this measure is 2019 from the U.S. Department of Agriculture (USDA) Food Environment Atlas.
Premature Age-Adjusted Mortality per 100,000: Number of deaths among residents under age 75 per 100,000 population (age-adjusted). The reporting period for this measure is 2018 through 2020 from CDC WONDER mortality data.
Preventable Hospital Stays per 1,000: The hospital discharge rate for ambulatory care-sensitive conditions per 1,000 fee-for-service Medicare enrollees. The reporting period for this measure is 2020.
Drove Alone to Work: Percentage of the workforce that drives alone to work. The data is from 2017-2021.
Total Medicare Reimbursements: Total Medicare reimbursements per enrollee adjusted for price, age, sex, and race. The reporting period for this measure is 2019.
Hospital and Skilled Nursing Facility Reimbursements: Reimbursement for hospital and skilled nursing facility per enrollee adjusted for price, age, sex, and race. The reporting period for this measure is 2019.
Physician Reimbursements: Reimbursement of physician services per enrollee adjusted for price, age, sex, and race as determined from actual Medicare claims data. The reporting period for this measure is 2019.
Outpatient Facility Reimbursements: Reimbursement of outpatient facility services per enrollee adjusted for price, age, sex, and race as determined from actual Medicare claims data. The reporting period for this measure is 2019.
Home Health Agency Reimbursements: Reimbursement of home health agency services per enrollee adjusted for price, age, sex, and race as determined from actual Medicare claims data. The reporting period for this measure is 2019.
Hospice Reimbursements: Reimbursement of hospice services per enrollee adjusted for price, age, sex, and race as determined from actual Medicare claims data. The reporting period for this measure is 2019.
Durable Medical Equipment Reimbursements: Reimbursement of durable medical equipment per enrollee adjusted for price, age, sex, and race as determined from actual Medicare claims data. The reporting period for this measure is 2019.