This data represents the most current publicly available information sources that are commonly used to study health care trends. The data is derived from the data sources listed below and combined to support the analysis.
A blank entry indicates unreported data. A value of zero is a defined value and does not represent unreported data.
State: The abbreviated name of the state where the county is located.
County: The name of the county where the information was collected. County names are listed as provided on the U.S. Census Bureau's list of 2020 FIPS Codes for Counties and County Equivalent Entities.
Population Size: The total number of individuals residing in the county. The data is derived from the Census Population Estimates from 2021.
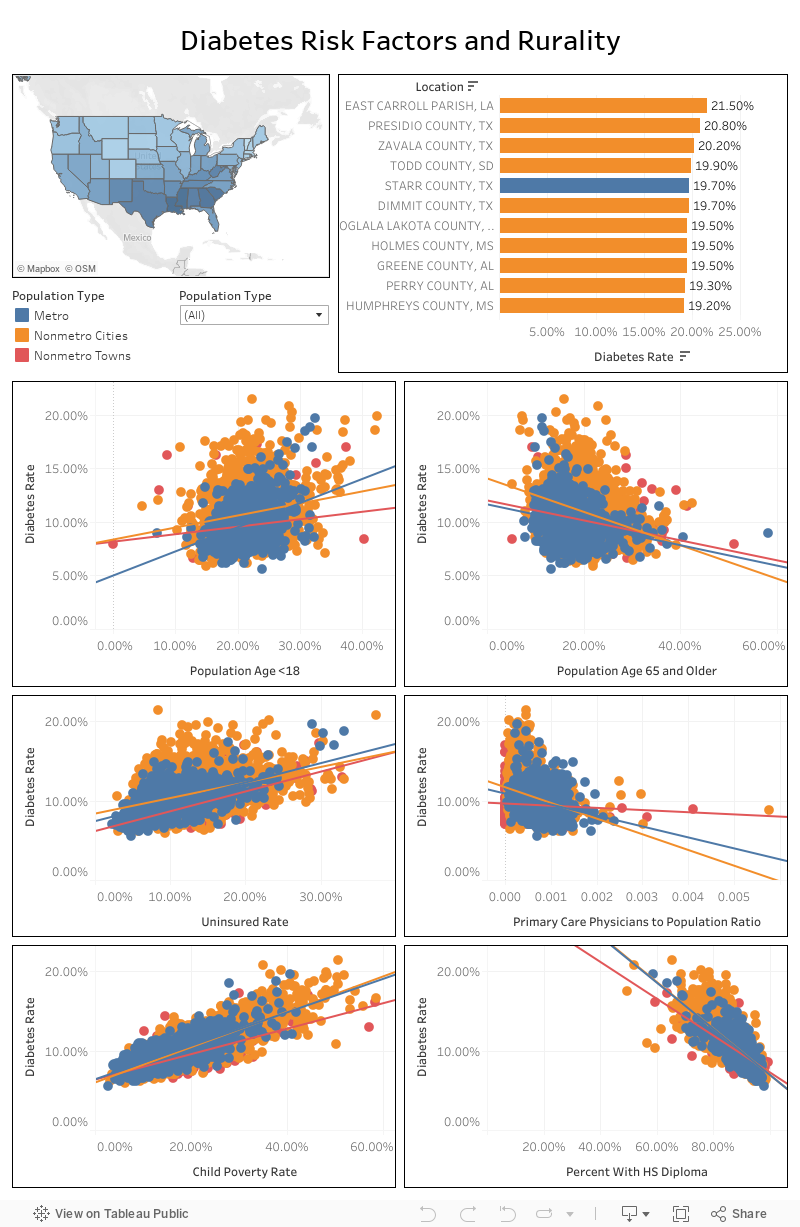
Population Type: The population type is determined based on the population size of a specific county. The population types include metro, nonmetro cities, and nonmetro towns. These types are adapted from the rural-urban commuting area codes (RUCA) and core-based statistical areas (CBSA) definitions of rural and urban. The population types for counties are defined as follows:
- Metro - A population of 50,000 or more
- Nonmetro cities - A population between 2,500 and less than 50,000
- Nonmetro towns - A population of less than 2,500
Medicare Enrollees: The total number of Medicare beneficiaries age 65-99 in the county for 2019 enrolled in both Medicare Parts A and B. Patients enrolled in risk-bearing health maintenance organizations (HMOs) are excluded.
Medicare Reimbursements/Enrollee: The average Medicare reimbursement for 100% of the claims for each county in 2019.
Diabetes Rate: The percentage of the county’s population that have diabetes. The measure is provided by the CDC Diabetes Interactive Atlas from 2020.
Child Poverty Rate: The percentage of children in the population who fall below the poverty level obtained from Small Area Income Poverty Estimates (SAIPE) in 2021.
Percent Asian: The proportion of the county’s population that falls into the racial or ethnic category of Asian from the U.S. Census Bureau Population Estimates from 2021.
Percent Black: The proportion of the county’s population that falls into the racial or ethnic category of Black from the U.S. Census Bureau Population Estimates from 2021.
Percent Hispanic: The proportion of the county’s population that falls into the racial or ethnic category of Hispanic from the U.S. Census Bureau Population Estimates from 2021.
Percent Native Hawaiian or Other Pacific Islander: The proportion of the county’s population that falls into the racial or ethnic category of Native Hawaiian or Other Pacific Islander from the U.S. Census Bureau Population Estimates from 2021.
Percent Native American: The proportion of the county’s population that falls into the racial or ethnic category of Native American from the U.S. Census Bureau Population Estimates from 2021.
Percent White: The proportion of the county’s population that falls into the racial or ethnic category of White from the U.S. Census Bureau Population Estimates from 2021.
Percent Age <18: The proportion of the county’s population that falls into the age category of less than 18 years old from the U.S. Census Bureau Population Estimates from 2021.
Percent Age 65 and Older: The proportion of the county’s population that falls into the age category of 65 years old and older from the U.S. Census Bureau Population Estimates from 2021.
Percent High School Diploma: Percentage of adults ages 25 and over with a high school diploma or equivalent. The data is from 2017-2021.
Percent Uninsured: The estimated percentage of individuals in the county under age 65 without health insurance. Data is from the Small Area Health Insurance Estimates Program (SAHIE) from 2020.
Percent Unemployed: The estimated percentage of individuals in the county who had no employment, were available for work and had made specific efforts to find employment. The number is from the annual U.S. Bureau of Labor Statistics’ Labor Force Data in 2021.
Primary Care Physicians: The number of primary care providers per 100,000 population. The data is derived from the Small Area Resource File and the American Medical Association from 2020.