A blank entry indicates unreported data. A value of zero is a defined value and does not represent unreported data.
State: The abbreviation of the state.
County: The name of the county. County names are listed as provided on the U.S. Census Bureau's list of 2020 FIPS Codes for Counties and County Equivalent Entities.
Population Size: The total number of individuals residing in the county. The data is derived from the Census Population Estimates from 2021.
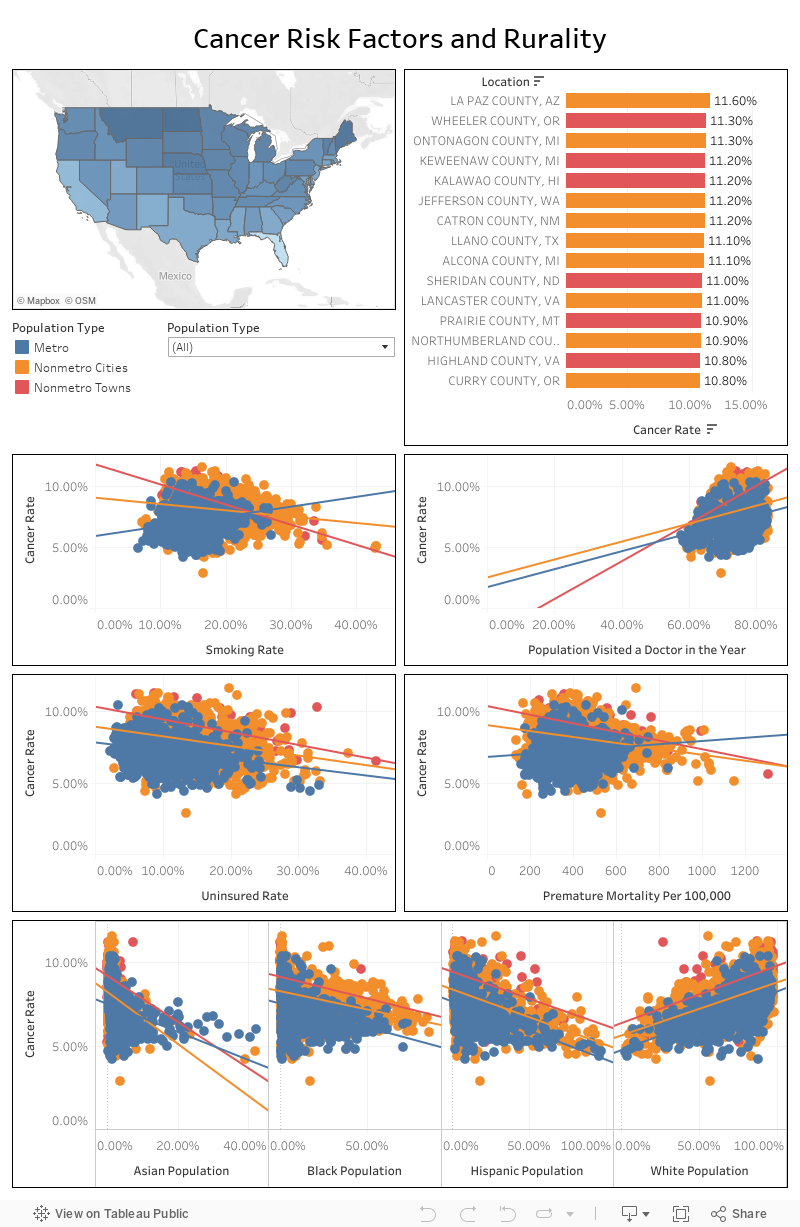
Population Type: The population type is determined based on the population size of a specific county. The population types include metro, nonmetro cities, and nonmetro towns. These types are adapted from the rural-urban commuting area codes (RUCA) and core-based statistical areas (CBSA) definitions of rural and urban. The population types for counties are defined as follows:
- Metro - A population of 50,000 or more
- Nonmetro cities - A population between 2,500 and less than 50,000
- Nonmetro towns - A population of less than 2,500
Percent Uninsured: The estimated number of individuals in the county under age 65 without health insurance. Data is from the Small Area Health Insurance Estimates (SAHIE) Program from 2020.
Child Poverty Rate: The percentage of children under age 18 living in poverty. Poverty status is defined by family; either everyone in the family is in poverty or no one in the family is in poverty. Data is from the Small Area Income Poverty Estimates (SAIPE) in 2021.
Premature Age-Adjusted Mortality per 100,000: Number of deaths among residents under age 75 per 100,000 population (age-adjusted). The reporting period for this measure is 2018 through 2020 from CDC WONDER mortality data.
Child Mortality: Number of deaths among residents under age 18 per 100,000 population. The 2023 County Health Rankings used data from 2017-2020 for this measure.
Infant Mortality: Number of infant deaths (within one year) per 1,000 live births. The 2023 County Health Rankings used data from 2014-2020 for this measure.
Uninsured Adults: Percentage of adults under age 65 without health insurance. The 2023 County Health Rankings used data from 2020 for this measure.
Uninsured Children: Percentage of children under age 19 without health insurance. The 2023 County Health Rankings used data from 2020 for this measure.
Access to Broadband: Percentage of households with a broadband internet connection (e.g. cable, DSL, fiber-optic, cell phone, or satellite) through a subscription. The measure is provided by the American Community Survey (ACS) and includes data collected between 2017 and 2021.
Visits to Doctor: Percentage of respondents greater than 18 years old who report having been to a doctor for a routine checkup (e.g., a general physical exam, not an exam for a specific injury, illness, condition) in the previous year. Data is from the Behavioral Risk Factor Surveillance System (BRFSS).
Percent Cancer: Percentage of respondents aged ≥18 years who report ever having been told by a doctor, nurse, or other health professional that they have cancer, besides skin cancer. The measure is provided by the BRFSS survey. Data is only provided for counties with more than 50 respondents to the BRFSS survey and is from 2020.
Percent Men Preventative Screenings: Percentage of men aged ≥65 years reporting having received all of the following: an influenza vaccination in the past year; a pneumococcal vaccination (PPV) ever; and either a fecal occult blood test (FOBT) within the past year, a sigmoidoscopy within the past 5 years and a FOBT within the past 3 years, or a colonoscopy within the past 10 years. The measure is provided by the BRFSS survey. Data is only provided for counties with more than 50 respondents to the BRFSS survey and is from 2020.
Percent Women Preventative Screenings: Percentage of women aged ≥65 years reporting having received all of the following: an influenza vaccination in the past year; a PPV ever; either a FOBT within the past year, a sigmoidoscopy within the past 5 years and a FOBT within the past 3 years, or a colonoscopy within the previous 10 years; and a mammogram in the past 2 years. The measure is provided by the BRFSS survey. Data is only provided for counties with more than 50 respondents to the BRFSS survey and is from 2020.
Percent Smoking: Percentage of respondents aged ≥18 years who report having smoked ≥100 cigarettes in their lifetime and currently smoke every day or some days. The measure is provided by the BRFSS survey. Data is only provided for counties with more than 50 respondents to the BRFSS survey and is from 2020.
Percent Asian: The proportion of the county’s population that falls into the racial or ethnic category of Asian from the U.S. Census Bureau Population Estimates from 2021.
Percent Black: The proportion of the county’s population that falls into the racial or ethnic category of Black from the U.S. Census Bureau Population Estimates from 2021.
Percent Hispanic: The proportion of the county’s population that falls into the racial or ethnic category of Hispanic from the U.S. Census Bureau Population Estimates from 2021.
Percent Native Hawaiian or Other Pacific Islander: The proportion of the county’s population that falls into the racial or ethnic category of Native Hawaiian or Other Pacific Islander from the U.S. Census Bureau Population Estimates from 2021.
Percent Native American: The proportion of the county’s population that falls into the racial or ethnic category of Native American from the U.S. Census Bureau Population Estimates from 2021.
Percent White: The proportion of the county’s population that falls into the racial or ethnic category of White from the U.S. Census Bureau Population Estimates from 2021.