This data represents the most current publicly available information sources that are commonly used to study health care trends. The data is derived from the data sources listed below and combined to support the analysis.
A blank entry indicates unreported data. A value of zero is a defined value and does not represent unreported data.
State: The abbreviation of the state.
County: The name of the county. County names are listed as provided on the U.S. Census Bureau's list of 2020 FIPS Codes for Counties and County Equivalent Entities.
Population Size: The total number of individuals residing in the county. The data is derived from the Census Population Estimates from 2021.
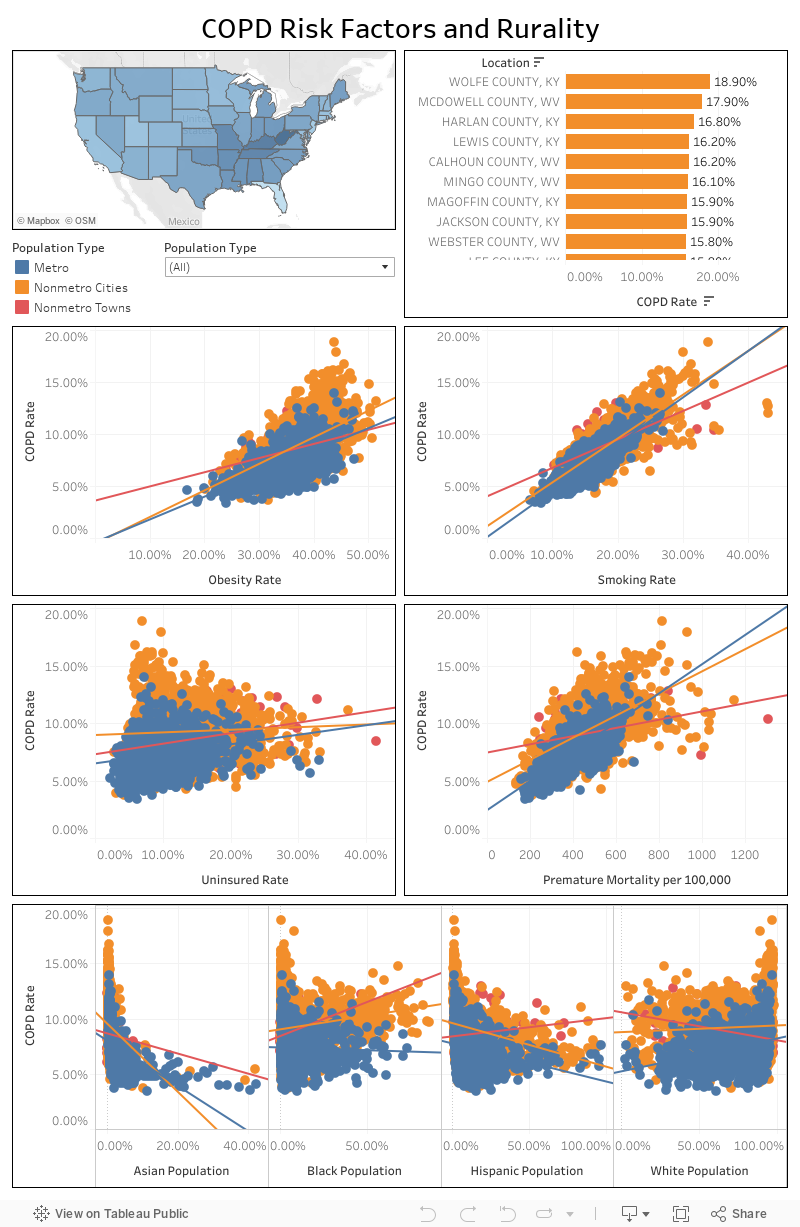
Population Type: The population type is determined based on the population size of a specific county. The population types include metro, nonmetro cities, and nonmetro towns. These types are adapted from the rural-urban commuting area codes (RUCA) and core-based statistical areas (CBSA) definitions of rural and urban. The population types for counties are defined as follows:
- Metro - A population of 50,000 or more
- Nonmetro cities - A population between 2,500 and less than 50,000
- Nonmetro towns - A population of less than 2,500
Percent Uninsured: The estimated number of individuals in the county under age 65 without health insurance. Data is from the Small Area Health Insurance Estimates (SAHIE) Program from 2020.
Child Poverty Rate: The percentage of children under age 18 living in poverty. Poverty status is defined by family; either everyone in the family is in poverty or no one in the family is in poverty. Data is from the Small Area Income Poverty Estimates (SAIPE) in 2021.
Premature Age-Adjusted Mortality per 100,000: Number of deaths among residents under age 75 per 100,000 population (age-adjusted). The reporting period for this measure is 2018 through 2020 from CDC WONDER mortality data.
Child Mortality: Number of deaths among residents under age 18 per 100,000 population. The 2023 County Health Rankings used data from 2017-2020 for this measure.
Infant Mortality: Number of infant deaths (within one year) per 1,000 live births. The 2023 County Health Rankings used data from 2014-2020 for this measure.
Uninsured Adults: Percentage of adults under age 65 without health insurance. The 2023 County Health Rankings used data from 2020 for this measure.
Uninsured Children: Percentage of children under age 19 without health insurance. The 2023 County Health Rankings used data from 2020 for this measure.
Percent COPD: Percentage of respondents aged ≥18 years who report ever having been told by a doctor, nurse, or other health professional that they had COPD, emphysema, or chronic bronchitis. The measure is provided by the Behavioral Risk Factor Surveillance System (BRFSS) survey. Data is only provided for counties with more than 50 respondents to the BRFSS survey and is from 2020.
Percent Smoking: Percentage of respondents aged ≥18 years who report having smoked ≥100 cigarettes in their lifetime and currently smoke every day or some days. The measure is provided by the BRFSS survey. Data is only provided for counties with more than 50 respondents to the BRFSS survey and is from 2020.
Obesity Rate: Percentage of respondents aged ≥18 years who have a body mass index (BMI) ≥30.0 kg/m² calculated from self-reported weight and height. The measure is provided by the BRFSS survey. Data is only provided for counties with more than 50 respondents to the BRFSS survey and is from 2020.
Visits to Doctor: Percentage of respondents greater than 18 years old who report having been to a doctor for a routine checkup (e.g., a general physical exam, not an exam for a specific injury, illness, or condition) in the previous year. Data is from the BRFSS.
Percent Uninsured: Percentage of people under age 65 without insurance. The reporting period for this measure is 2019 from the SAHIE program.
Percent Asian: The proportion of the county’s population that falls into the racial or ethnic category of Asian from the U.S. Census Bureau Population Estimates from 2021.
Percent Black: The proportion of the county’s population that falls into the racial or ethnic category of Black from the U.S. Census Bureau Population Estimates from 2021.
Percent Hispanic: The proportion of the county’s population that falls into the racial or ethnic category of Hispanic from the U.S. Census Bureau Population Estimates from 2021.
Percent Native Hawaiian or Other Pacific Islander: The proportion of the county’s population that falls into the racial or ethnic category of Native Hawaiian or Other Pacific Islander from the U.S. Census Bureau Population Estimates from 2021.
Percent Native American: The proportion of the county’s population that falls into the racial or ethnic category of Native American from the U.S. Census Bureau Population Estimates from 2021.
Percent White: The proportion of the county’s population that falls into the racial or ethnic category of White from the U.S. Census Bureau Population Estimates from 2021.